
NCS2M
Anchored in Consumer State — NeuGenM's Consumer State Signal Framework. Consumer State is a function of Persona, Entry Point and Solution Clarity, which yields the four quadrants every metric is split across.
AI GEO/AEO Performance Audit · 2026
We measured how the 100 most valuable brands in Vietnam actually appear in AI answers — 1,000 branded prompts and 40 category prompts across ChatGPT, Claude and Gemini, in English and Vietnamese. Ask an engine about a brand and it answers almost perfectly. Ask it about the category and the brand disappears.
01 — The finding
Everything in this report is a consequence of a single asymmetry.
Headline
Vietnam's biggest brands have won their own name in AI and lost their category.
Average branded presence is 95.8%; average category presence is 11.6%. Brands are recommended in 49.2% of their branded answers and just 1.7% of category answers. The composite AI Pulse averages 37.3/100 — an AI Visibility Gap of 62.7% — and not one of the Top 100 cleared a B grade.
02 — Method
Measured from real engine responses, not estimated in aggregate. Every number here traces to a stored answer.
Anchored in Consumer State — NeuGenM's Consumer State Signal Framework. Consumer State is a function of Persona, Entry Point and Solution Clarity, which yields the four quadrants every metric is split across.
1,000 branded prompts and 40 category prompts × 3 engines (+1 grounded mode) × English plus Vietnamese, spanning 100 brands across 26 audited categories.
ChatGPT (OpenAI), Claude (Anthropic) and Gemini (Google) ungrounded, plus Google Search AI Mode — the grounded, citation-bearing engine and the only source of citation data.
Presence, Competitive Edge, Share of Voice, Recommendation Rate, Citation Authority, Sentiment, Vernacular Coverage, Positioning Alignment and Variance — plus a 49-parameter GEO/AEO/SEO content-readiness crawl.
All of it distilled into one composite AI Pulse score, 0–100.
03 — Findings
Two of the five are the same problem seen from different angles — which is itself the finding.
95.8% branded presence against 11.6% category presence. Brands are in the models' memory — they are simply not in the category answer. The gap of roughly 84 points holds on every engine, so it is not one model's quirk.
Average owned category citation authority is 0.4%. 63 of 100 brands sit at a flat 0%, and 91 are under 1%. When AI answers a category question it sources from third-party authority sites, not from the brand.
49.2% branded, 1.7% unbranded. 54 of 100 brands are never recommended in a category answer at all. Being remembered and being recommended are different achievements, and only the first has been earned.
The sites have the substance; the machines cannot read it. Across the content-readiness crawls the recurring cause of a near-zero owned-citation score is missing or malformed machine-readable structure — absent or empty schema, unmarked FAQ content, offers with no price or currency, entity nodes that never name the brand — on sites whose content is itself substantive and crawlable.
Where a CDN returns 403 to datacenter clients, that is IP-reputation filtering and is not evidence that AI crawlers are blocked. Establishing that needs edge logs, so it is flagged per brand rather than assumed.
This is a non-finding, and that is the point. In Vietnamese, category citation authority is ~0.8% against English's ~0.4%, and branded vernacular (~18.2%) tracks branded English (~18.8%). The two registers sit within half a point of each other.
The citation blackout is a category problem, not a language one — which makes sense, because Vietnamese brands already publish in Vietnamese.
04 — The score
Average Pulse 37.3/100 · Gap 62.7%. GEO 5.4/10 · AEO 3.1/10 · SEO 6.6/10 — classic SEO is the relative strength.
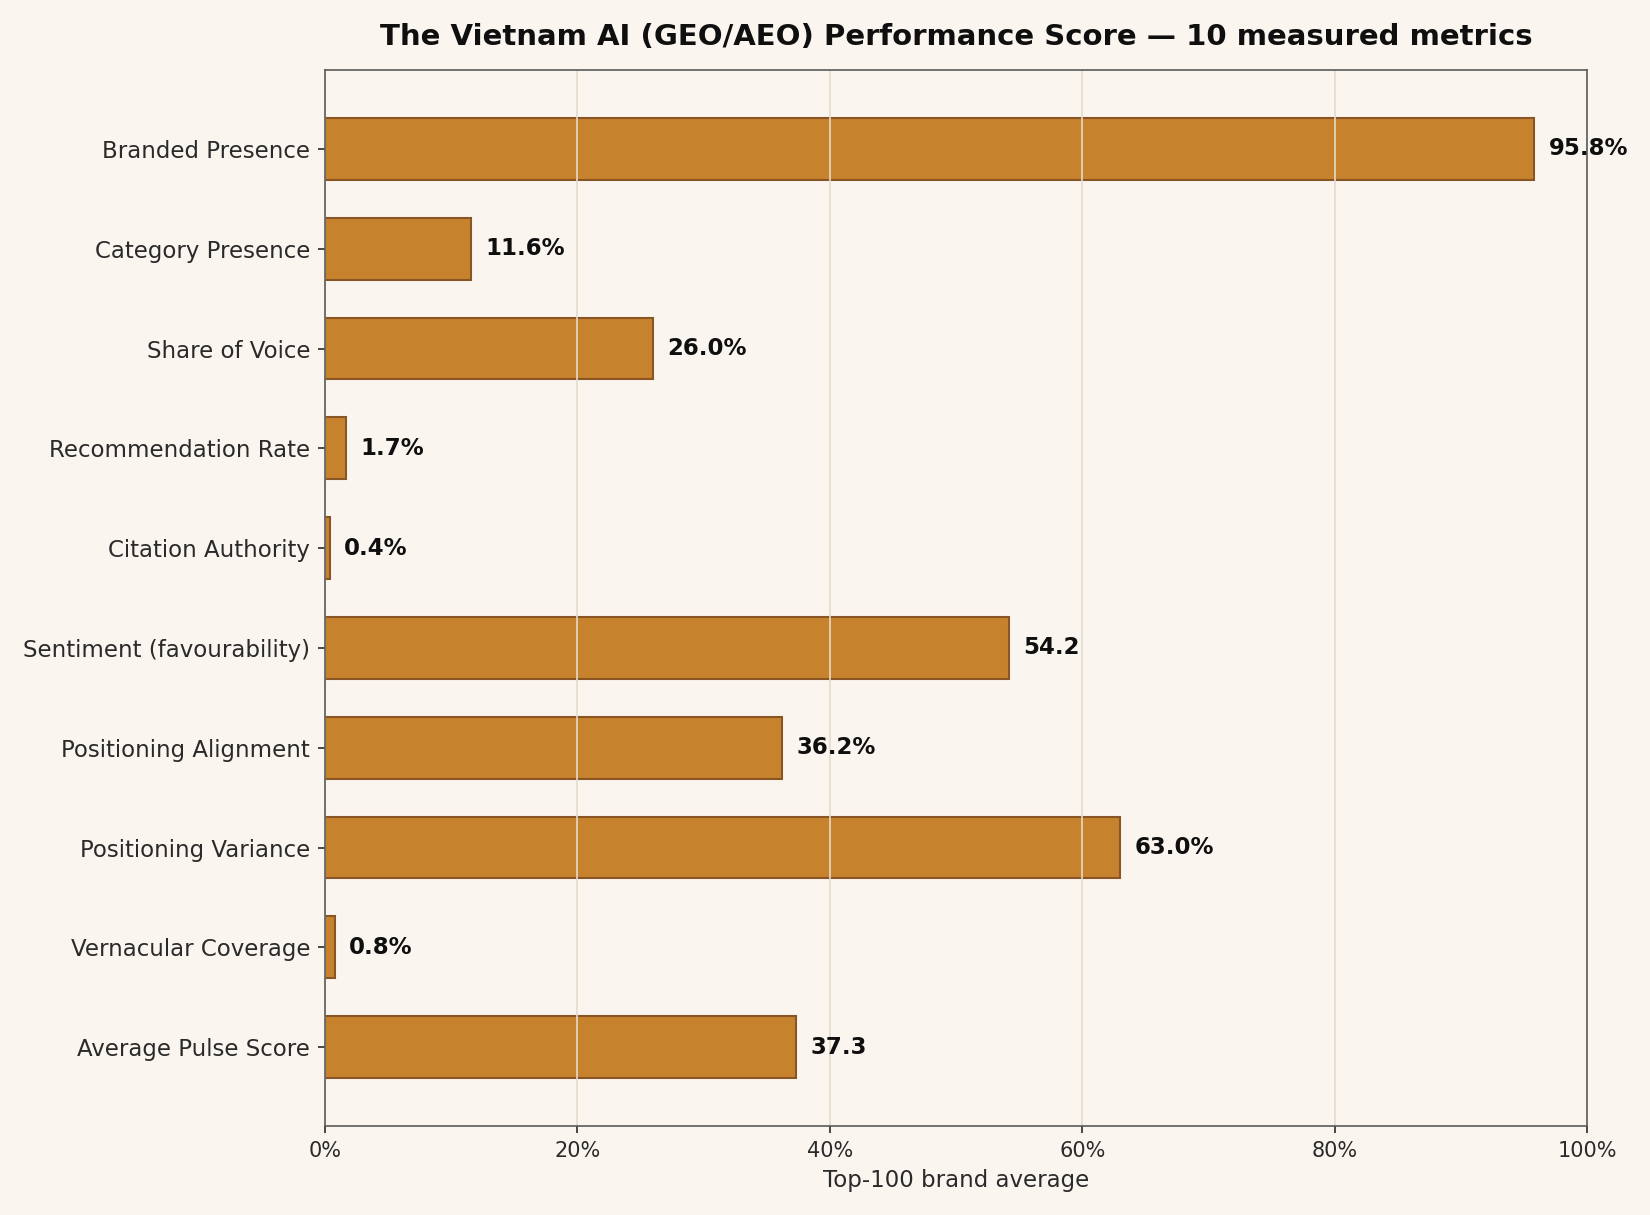
One caveat on Share of Voice. It is the brand's share of brand mentions among the audited brand set in category answers — not its share of the whole category. Brands outside the audited set are absent from the denominator, so for a narrow brand set this figure overstates true category share.
05 — By category
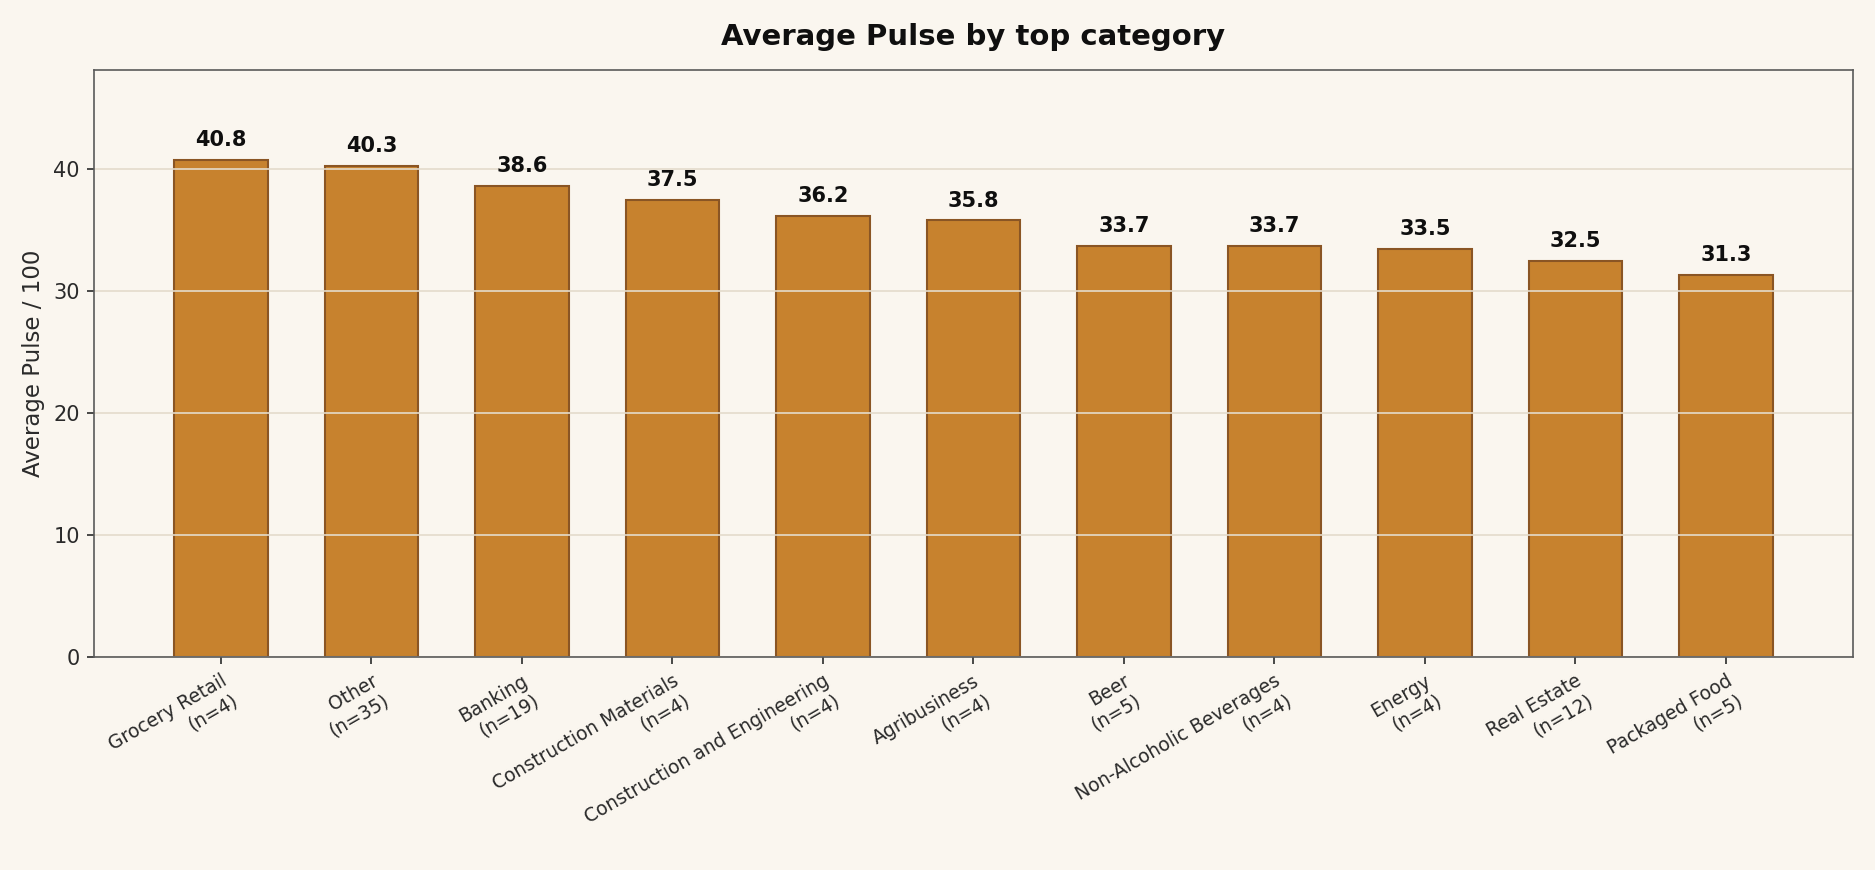
The best-performing large category sits at 40.8 Pulse. The spread between sectors is narrower than the gap any of them has to close.
| Category | Brands (n) | Avg Pulse |
|---|---|---|
| Banking | 19 | 38.6 |
| Real Estate | 12 | 32.5 |
| Beer | 5 | 33.7 |
| Packaged Food | 5 | 31.3 |
| Agribusiness | 4 | 35.8 |
| Construction and Engineering | 4 | 36.2 |
| Construction Materials | 4 | 37.5 |
| Energy | 4 | 33.5 |
| Grocery Retail | 4 | 40.8 |
| Non-Alcoholic Beverages | 4 | 33.7 |
| Other | 35 | 40.3 |
| Overall (Top 100) | 100 | 37.3 |
06 — By engine
Branded presence is near-universal on all three engines. Category presence is near-absent on all three.
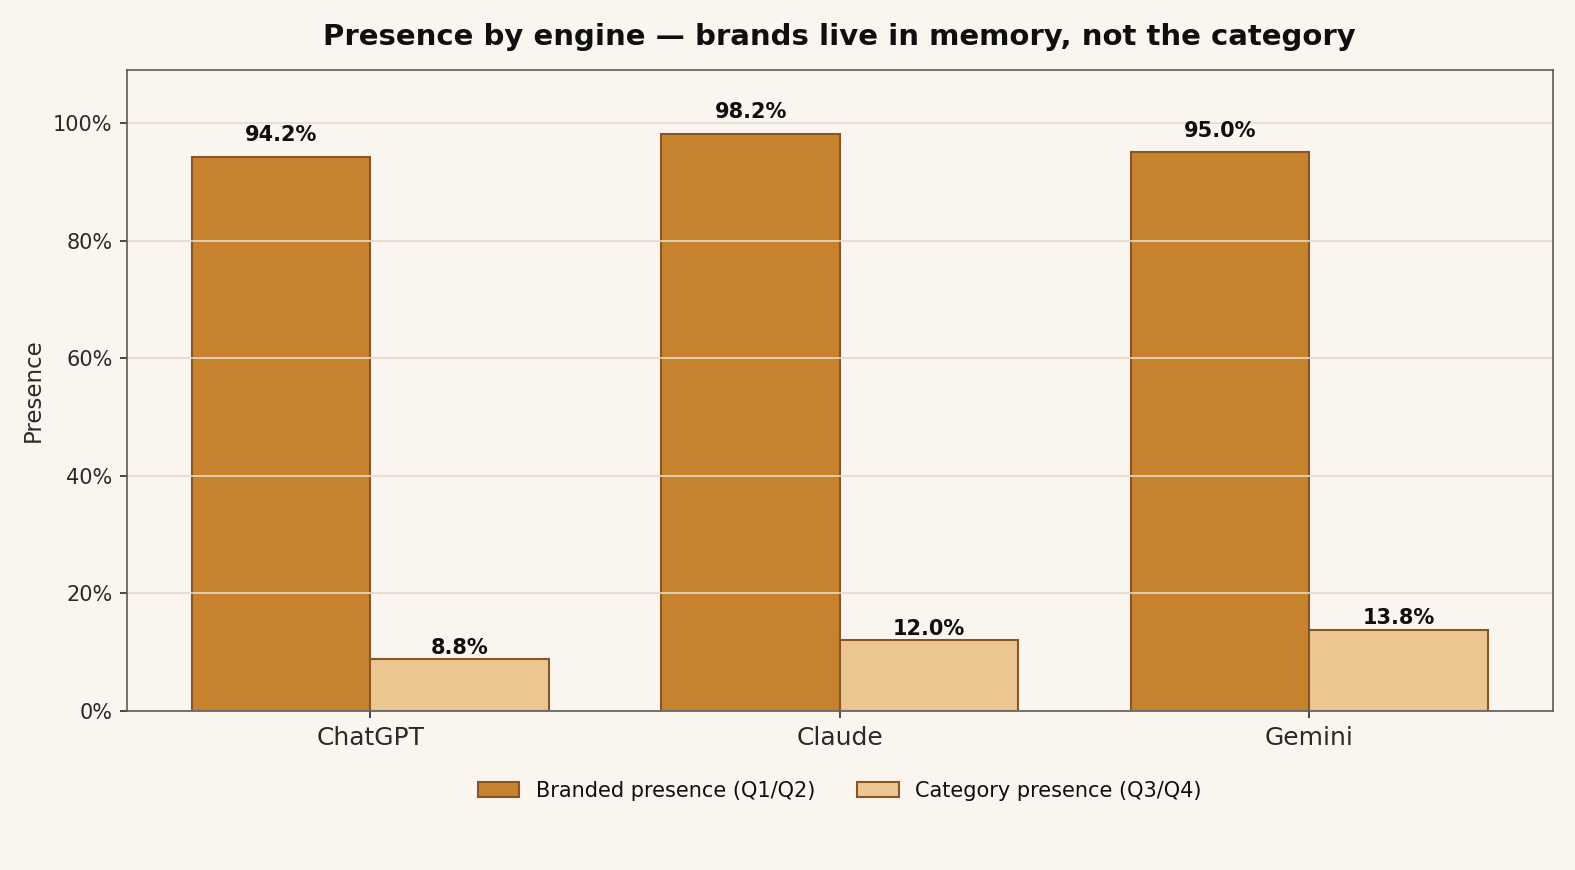
| Engine | Branded | Category | Gap |
|---|---|---|---|
| ChatGPT | 94.2% | 8.8% | 85.4% |
| Claude | 98.2% | 12.0% | 86.2% |
| Gemini | 95.0% | 13.8% | 81.2% |
Brands own their name everywhere. Almost none has earned its category anywhere. Because the pattern is consistent across three independently trained models, it reflects what the open web makes available about these brands — not a quirk of any one engine's ranking.
07 — Language
The framework was built on an India result where vernacular lagged badly. Vietnam inverts it.
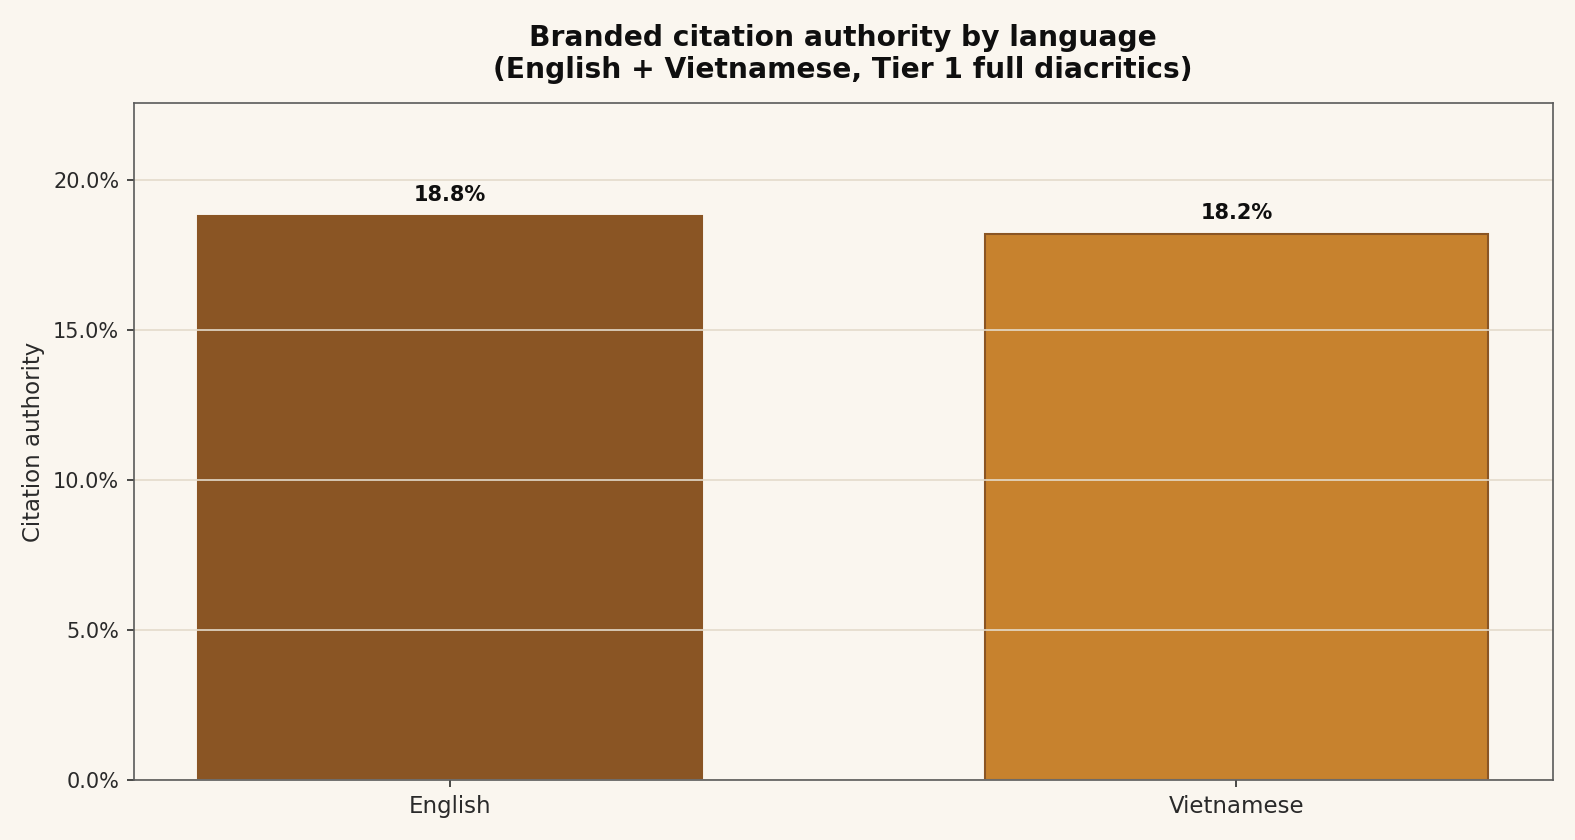
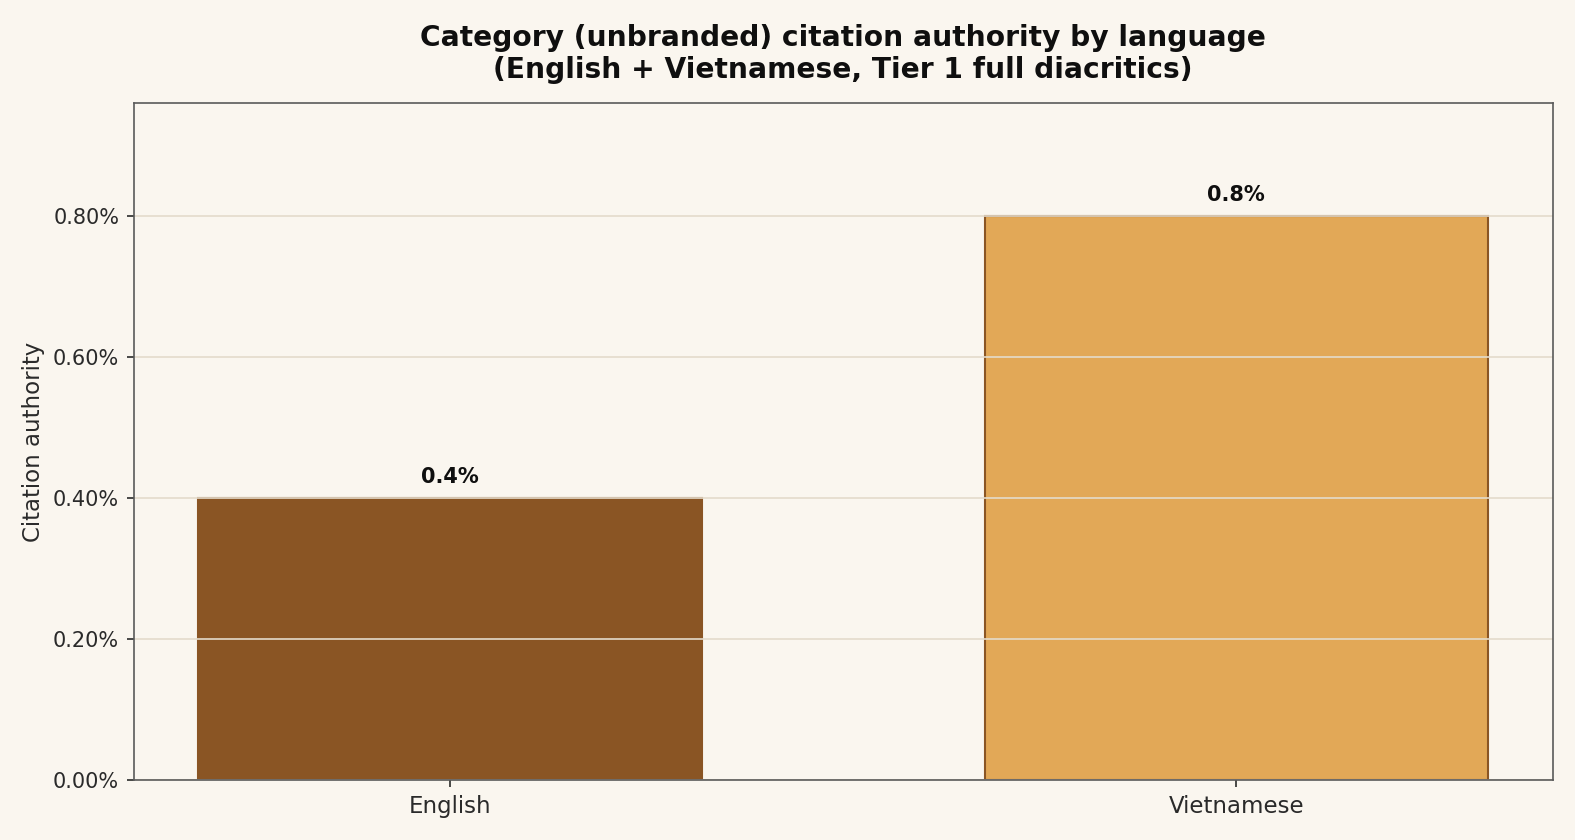
| Language | Branded citation | Category citation |
|---|---|---|
| English | 18.8% | 0.4% |
| Vietnamese | 18.2% | 0.8% |
What this rules out. A vernacular content gap would show up as branded Vietnamese authority well below branded English. It does not: 18.2% against 18.8%. The blackout is near-total in every language measured, so translating existing pages will not fix it. Grounded responses came from Google Search AI Mode per the run's vernacular model policy — gemini-2.5-flash, with automatic fallback to gemini-3.5-flash on a persistent rate limit. Tier 3 (code-switched) queries were collected but are excluded from these figures; Vietnamese is Latin-script, so it has no transliteration tier.
08 — Consumer state
The same 2×2 read three ways: what the site is ready for, what gets recommended, and what gets cited.
Average site readiness score for each state, out of 10.
| Brand affinity ↓ / Consumer intent → | Exploratory | Solution clarity |
|---|---|---|
| Branded | Q1Vertical Brand Consultation6.7/10 |
Q2Frictionless Commerce4.8/10 |
| Unbranded | Q3Synthesized Discovery3.5/10 |
Q4Agentic Procurement6.3/10 |
Q3 — the state where a buyer asks "what are the best options?" without naming anyone — is the weakest quadrant in the market at 3.5/10. It is also the state that most category answers are generated from.
Share of answers in each state that actively recommend the brand, not merely mention it.
| Brand affinity ↓ / Consumer intent → | Exploratory | Solution clarity |
|---|---|---|
| Branded | Q1Vertical Brand Consultation57.5% |
Q2Frictionless Commerce40.8% |
| Unbranded | Q3Synthesized Discovery0.4% |
Q4Agentic Procurement3.0% |
A brand asked about directly is recommended more than half the time. The same brand, in an answer about its own category, is recommended in four answers in a thousand.
Share of the answer's citations pointing at the brand's own domain.
| Brand affinity ↓ / Consumer intent → | Exploratory | Solution clarity |
|---|---|---|
| Branded | Q1Vertical Brand Consultation18.13% |
Q2Frictionless Commerce20.05% |
| Unbranded | Q3Synthesized Discovery0.15% |
Q4Agentic Procurement0.65% |
Answers about the category are sourced from third-party authority sites. Even when a brand is named, the sentence explaining it was written by someone else.
09 — The ranking
Seven brands reached a C. None reached a B. The leaders share the market's pattern; they are just less far behind.
| # | Brand | Category | Pulse | Grade | Branded pres. | Category pres. |
|---|---|---|---|---|---|---|
| 1 | Vinmec | Healthcare | 57.5 | C | 100.0% | 38.3% |
| 2 | Vietnam Airlines | Airlines | 55.8 | C | 100.0% | 62.5% |
| 3 | Vinschool | Education | 52.5 | C | 100.0% | 24.2% |
| 4 | Viettel Group | Telecommunications | 52.1 | C | 100.0% | 61.7% |
| 5 | Petrolimex | Energy (Including Oil & Gas) | 51.3 | C | 100.0% | 19.2% |
| 6 | Vinamilk | Non-Alcoholic Beverages | 51.0 | C | 100.0% | 17.5% |
| 7 | PNJ | Jewelry | 50.9 | C | 100.0% | 34.2% |
| 8 | Gemadept | Logistics and Shipping | 49.5 | D+ | 100.0% | 5.8% |
| 9 | Vietjet Air | Airlines | 47.9 | D+ | 100.0% | 61.7% |
| 10 | Techcombank | Banking | 47.3 | D+ | 100.0% | 25.8% |
Vinmec, Vietnam Airlines and Vinschool lead — yet each shows the same shape as the market: strong branded performance, thin owned category citations. Every one of them is recommended in its category far more often than it is cited from its own domain, which is the tell that the equity is in the model's memory rather than in the retrievable web.
| # | Brand | Category | Pulse | Grade | Branded pres. | Category pres. |
|---|---|---|---|---|---|---|
| 91 | Hoang Huy | Real Estate (Including Residential) | 28.8 | D | 93.3% | 0.0% |
| 92 | Bach Hoa XANH | Grocery Retail | 28.7 | D | 56.7% | 20.8% |
| 93 | Dat Xanh Group | Real Estate (Including Residential) | 28.0 | D | 96.7% | 0.8% |
| 94 | Wake-up 247 | Non-Alcoholic Beverages | 27.4 | D | 100.0% | 0.0% |
| 95 | Quang Ngai Sugar (QNS) | Non-Alcoholic Beverages | 26.9 | D | 90.0% | 0.0% |
| 96 | Tuong An | Packaged Food | 26.4 | D | 76.7% | 0.0% |
| 97 | CII | Transport Infrastructure | 26.2 | D | 96.7% | 0.0% |
| 98 | Nam Ngu | Packaged Food | 25.0 | D | 76.7% | 0.0% |
| 99 | Pha Lai Thermal Power | Energy (Including Oil & Gas) | 23.2 | F | 86.7% | 0.0% |
| 100 | 333' Export (Sabeco) | Beer | 22.5 | F | 56.7% | 4.2% |
The lowest-Pulse brands keep near-universal branded presence and then collapse in-category, commonly at 0% owned category citation authority. Where the crawls reached these sites the cause was consistently structural — absent or invalid schema, unmarked answer content, unattributed editorial — rather than an absence of content.
10 — The pattern
Six behaviours separate the brands an engine can use from the brands it can only remember.
No WAF or CDN 403 served to AI crawlers; robots.txt permits GPTBot, ClaudeBot and Google-Extended.
Valid JSON-LD — Organization, Product, FAQ, Article, Offer — and sitemaps that are actually fresh.
Citable, comparison-shaped "best X" content, not only brand pages. The category question needs a category page.
So equity and citations do not leak across parallel .com, country and sub-brand sites.
llms.txt and agentic endpoints.UCP and MCP surfaces — and back them with real structured cargo rather than a stub.
Which is how a mention becomes a citation, and a citation becomes a recommendation.
11 — What to do
Ordered by cost-to-impact, not by ambition. The first tranche is mostly engineering hygiene.
Audit and remove AI-crawler blocks — the cheapest, highest-impact fix available. Ship or repair JSON-LD and a fresh sitemap. Publish llms.txt.
Build decision-shaped content for the unbranded "best X" questions. Consolidate fragmented domains. Instrument owned-citation share as a tracked KPI, not a one-off audit number.
Win third-party and category-authority inclusion. Stand up agentic commerce (UCP/MCP) with real product and offer data. Extend the whole programme to Vietnamese.
12 — Conclusion
The read
The category answer in AI is still unowned.
63 of the 100 audited brands cite themselves 0% of the time in their own category. That is not a threat readout — it is an open field. Nobody has taken it.
The brands that unblock the engines, structure their content and publish the category answer first will compound an advantage that is, today, almost entirely unclaimed.
Appendix A
Pulse and the GEO / AEO / SEO components per audited category, with the Top-100 total.
| Category | n | Pulse | GEO | AEO | SEO | Cat presence | Owned cat cit |
|---|---|---|---|---|---|---|---|
| Healthcare | 1 | 57.5 | 8.5 | 5.5 | 8.5 | 38.3% | 1.10% |
| Education | 1 | 52.5 | 0.0 | 0.0 | 0.0 | 24.2% | 0.20% |
| Airlines | 2 | 51.8 | 3.0 | 2.8 | 4.2 | 62.1% | 10.00% |
| Jewelry | 1 | 50.9 | 0.0 | 0.0 | 0.0 | 34.2% | 0.40% |
| Telecommunications | 3 | 44.9 | 6.8 | 4.2 | 7.0 | 51.9% | 0.43% |
| Paper and Packaging | 1 | 43.1 | 0.0 | 0.0 | 0.0 | 0.8% | 0.00% |
| Stationery | 1 | 42.3 | 4.0 | 3.5 | 4.0 | 1.7% | 0.00% |
| Logistics and Shipping | 2 | 41.0 | 8.0 | 2.5 | 7.5 | 2.9% | 0.10% |
| Grocery Retail | 4 | 40.8 | 5.7 | 2.8 | 7.2 | 32.7% | 0.10% |
| Steel | 3 | 40.5 | 6.8 | 3.0 | 6.5 | 17.5% | 0.83% |
| IT Services | 2 | 40.1 | 3.5 | 4.0 | 7.5 | 14.6% | 0.00% |
| Banking | 19 | 38.6 | 5.1 | 3.0 | 6.6 | 8.6% | 0.37% |
| Construction Materials | 4 | 37.5 | 6.5 | 2.2 | 4.3 | 7.7% | 0.00% |
| Automotive and Mobility | 3 | 36.7 | 5.8 | 4.8 | 6.5 | 12.5% | 0.10% |
| Chemicals and Plastics | 2 | 36.6 | 7.5 | 3.0 | 6.0 | 1.2% | 0.10% |
| Insurance and Securities | 3 | 36.5 | 4.5 | 3.8 | 7.8 | 13.1% | 0.20% |
| Construction and Engineering | 4 | 36.2 | 6.2 | 3.5 | 9.2 | 9.2% | 0.20% |
| Consumer Electronics Retail | 3 | 36.0 | 3.0 | 3.5 | 9.2 | 2.2% | 0.13% |
| Agribusiness | 4 | 35.8 | 5.4 | 4.4 | 5.8 | 2.1% | 0.05% |
| Apparel and Textiles | 3 | 35.5 | 4.8 | 2.5 | 5.3 | 5.3% | 0.07% |
| Beer | 5 | 33.7 | 4.2 | 3.3 | 5.2 | 10.2% | 0.08% |
| Non-Alcoholic Beverages | 4 | 33.7 | 6.6 | 3.5 | 7.5 | 4.4% | 0.42% |
| Energy (Including Oil & Gas) | 4 | 33.5 | 2.2 | 2.0 | 4.8 | 7.3% | 0.53% |
| Transport Infrastructure | 4 | 33.5 | 6.2 | 4.0 | 7.3 | 15.2% | 0.25% |
| Real Estate (Including Residential) | 12 | 32.5 | 4.3 | 2.4 | 7.2 | 3.2% | 0.03% |
| Packaged Food | 5 | 31.3 | 7.3 | 2.2 | 7.6 | 4.0% | 0.00% |
| Overall (Top 100) | 100 | 37.3 | 5.4 | 3.1 | 6.6 | 11.6% | 0.4% |
Appendix B
All 100 brands by AI Pulse, with branded and category presence and citation authority.
| # | Brand | Category | Pulse | Grade | Br pres | Cat pres | Br cit | Cat cit |
|---|---|---|---|---|---|---|---|---|
| 1 | Vinmec | Healthcare | 57.5 | C | 100.0% | 38.3% | 55.4% | 1.1% |
| 2 | Vietnam Airlines | Airlines | 55.8 | C | 100.0% | 62.5% | 42.7% | 12.3% |
| 3 | Vinschool | Education | 52.5 | C | 100.0% | 24.2% | 85.2% | 0.2% |
| 4 | Viettel Group | Telecommunications | 52.1 | C | 100.0% | 61.7% | 0.8% | 0.4% |
| 5 | Petrolimex | Energy (Including Oil & Gas) | 51.3 | C | 100.0% | 19.2% | 52.6% | 2.1% |
| 6 | Vinamilk | Non-Alcoholic Beverages | 51.0 | C | 100.0% | 17.5% | 31.9% | 1.7% |
| 7 | PNJ | Jewelry | 50.9 | C | 100.0% | 34.2% | 9.5% | 0.4% |
| 8 | Gemadept | Logistics and Shipping | 49.5 | D+ | 100.0% | 5.8% | 57.1% | 0.2% |
| 9 | Vietjet Air | Airlines | 47.9 | D+ | 100.0% | 61.7% | 42.7% | 7.7% |
| 10 | Techcombank | Banking | 47.3 | D+ | 100.0% | 25.8% | 77.9% | 0.9% |
| 11 | Coteccons | Construction and Engineering | 47.2 | D+ | 100.0% | 24.2% | 46.0% | 0.8% |
| 12 | WinMart | Grocery Retail | 45.8 | D+ | 96.7% | 47.5% | 11.9% | 0.0% |
| 13 | MM Mega Market | Grocery Retail | 45.8 | D+ | 100.0% | 20.0% | 75.5% | 0.2% |
| 14 | Saigon (Bia Saigon / Sabeco) | Beer | 45.7 | D+ | 100.0% | 24.2% | 6.9% | 0.2% |
| 15 | VPBank | Banking | 44.9 | D+ | 100.0% | 22.5% | 62.5% | 0.0% |
| 16 | FPT | IT Services | 44.9 | D+ | 100.0% | 20.8% | 9.4% | 0.0% |
| 17 | Hoa Phat | Steel | 44.8 | D+ | 100.0% | 22.5% | 36.6% | 2.5% |
| 18 | BIDV | Banking | 43.5 | D+ | 100.0% | 20.8% | 60.6% | 0.5% |
| 19 | Vinaphone | Telecommunications | 43.4 | D+ | 100.0% | 45.8% | 0.0% | 0.0% |
| 20 | VinFast | Automotive and Mobility | 43.4 | D+ | 100.0% | 25.0% | 0.7% | 0.3% |
| 21 | VietinBank | Banking | 43.2 | D+ | 100.0% | 12.5% | 73.6% | 1.1% |
| 22 | TPBank | Banking | 43.1 | D+ | 100.0% | 5.0% | 77.5% | 0.4% |
| 23 | DOHACO | Paper and Packaging | 43.1 | D+ | 100.0% | 0.8% | 0.0% | 0.0% |
| 24 | Co.opmart | Grocery Retail | 43.0 | D+ | 100.0% | 42.5% | 2.7% | 0.2% |
| 25 | An Phat Bioplastics | Chemicals and Plastics | 42.8 | D+ | 100.0% | 1.7% | 13.5% | 0.2% |
| 26 | Hoa Sen Group | Steel | 42.4 | D+ | 100.0% | 19.2% | 18.1% | 0.0% |
| 27 | Thien Long | Stationery | 42.3 | D+ | 76.7% | 1.7% | 11.6% | 0.0% |
| 28 | Vinh Hoan | Agribusiness | 42.2 | D+ | 100.0% | 4.2% | 51.1% | 0.2% |
| 29 | Vietcombank | Banking | 42.1 | D+ | 100.0% | 28.3% | 47.2% | 1.4% |
| 30 | Vinhomes | Real Estate (Including Residential) | 41.3 | D+ | 100.0% | 14.2% | 9.8% | 0.2% |
| 31 | Agribank | Banking | 41.0 | D+ | 100.0% | 10.8% | 25.0% | 0.5% |
| 32 | KienlongBank | Banking | 41.0 | D+ | 100.0% | 0.0% | 80.6% | 0.0% |
| 33 | Sacombank | Banking | 40.9 | D+ | 100.0% | 5.0% | 75.4% | 0.0% |
| 34 | Vicostone | Construction Materials | 40.1 | D+ | 100.0% | 5.0% | 40.1% | 0.0% |
| 35 | Tan Son Nhat International Airport | Transport Infrastructure | 39.8 | D | 96.7% | 34.2% | 0.0% | 0.0% |
| 36 | Viglacera | Construction Materials | 39.5 | D | 100.0% | 18.3% | 0.0% | 0.0% |
| 37 | Mobifone | Telecommunications | 39.2 | D | 100.0% | 48.3% | 9.4% | 0.9% |
| 38 | Bao Viet | Insurance and Securities | 39.0 | D | 96.7% | 21.7% | 7.0% | 0.2% |
| 39 | Thanh Cong (TCM) | Apparel and Textiles | 39.0 | D | 100.0% | 4.2% | 42.5% | 0.2% |
| 40 | HDBank | Banking | 38.8 | D | 100.0% | 3.3% | 52.7% | 0.0% |
| 41 | MB Bank | Banking | 38.5 | D | 96.7% | 15.0% | 13.7% | 0.0% |
| 42 | PVI (PetroVietnam Insurance) | Insurance and Securities | 38.0 | D | 96.7% | 15.8% | 15.1% | 0.4% |
| 43 | Vicem Ha Tien | Construction Materials | 38.0 | D | 100.0% | 6.7% | 6.0% | 0.0% |
| 44 | Chin-Su | Packaged Food | 37.8 | D | 100.0% | 10.8% | 0.0% | 0.0% |
| 45 | thegioididong.com | Consumer Electronics Retail | 37.7 | D | 90.0% | 1.7% | 42.0% | 0.0% |
| 46 | Dabaco | Agribusiness | 37.4 | D | 100.0% | 2.5% | 0.0% | 0.0% |
| 47 | ACB | Banking | 37.1 | D | 100.0% | 10.0% | 24.7% | 0.4% |
| 48 | VIB | Banking | 37.0 | D | 96.7% | 4.2% | 47.8% | 0.9% |
| 49 | Noi Bai International Airport | Transport Infrastructure | 36.7 | D | 83.3% | 26.7% | 8.1% | 1.0% |
| 50 | IDICO | Real Estate (Including Residential) | 35.9 | D | 100.0% | 0.0% | 30.9% | 0.0% |
| 51 | Vinatex | Apparel and Textiles | 35.6 | D | 100.0% | 5.8% | 8.6% | 0.0% |
| 52 | SeABank | Banking | 35.5 | D | 100.0% | 0.0% | 28.2% | 0.4% |
| 53 | Digiworld | Consumer Electronics Retail | 35.4 | D | 100.0% | 2.5% | 0.0% | 0.0% |
| 54 | CMC Corp | IT Services | 35.3 | D | 100.0% | 8.3% | 0.0% | 0.0% |
| 55 | Dien May XANH | Consumer Electronics Retail | 34.8 | D | 63.3% | 2.5% | 44.2% | 0.4% |
| 56 | Vincom Retail | Real Estate (Including Residential) | 34.8 | D | 100.0% | 2.5% | 0.0% | 0.0% |
| 57 | GREENSM (GSM) | Automotive and Mobility | 34.7 | D | 100.0% | 12.5% | 0.0% | 0.0% |
| 58 | Omachi | Packaged Food | 34.6 | D | 100.0% | 4.2% | 0.8% | 0.0% |
| 59 | Masterise Homes | Real Estate (Including Residential) | 34.5 | D | 100.0% | 5.0% | 22.2% | 0.0% |
| 60 | Nam Kim Steel | Steel | 34.4 | D | 100.0% | 10.8% | 0.0% | 0.0% |
| 61 | Larue | Beer | 34.1 | D | 86.7% | 14.2% | 0.0% | 0.0% |
| 62 | Huda | Beer | 34.0 | D | 100.0% | 5.0% | 4.3% | 0.0% |
| 63 | LPBank | Banking | 33.5 | D | 96.7% | 0.0% | 0.0% | 0.0% |
| 64 | REE Corporation | Construction and Engineering | 33.4 | D | 100.0% | 5.8% | 0.0% | 0.0% |
| 65 | Vinpearl | Real Estate (Including Residential) | 33.2 | D | 100.0% | 1.7% | 20.2% | 0.0% |
| 66 | PC1 | Construction and Engineering | 33.1 | D | 100.0% | 6.7% | 0.0% | 0.0% |
| 67 | Nam Long | Real Estate (Including Residential) | 33.1 | D | 100.0% | 7.5% | 0.0% | 0.0% |
| 68 | Kokomi | Packaged Food | 32.9 | D | 96.7% | 5.0% | 0.0% | 0.0% |
| 69 | AgriS (TTC Agris) | Agribusiness | 32.9 | D | 100.0% | 0.8% | 0.9% | 0.0% |
| 70 | OCB | Banking | 32.8 | D | 96.7% | 0.0% | 16.2% | 0.0% |
| 71 | Phu Tai | Construction Materials | 32.5 | D | 100.0% | 0.8% | 4.7% | 0.0% |
| 72 | Vietcap | Insurance and Securities | 32.5 | D | 100.0% | 1.7% | 0.0% | 0.0% |
| 73 | Viconship | Logistics and Shipping | 32.5 | D | 96.7% | 0.0% | 20.7% | 0.0% |
| 74 | MSB | Banking | 32.4 | D | 100.0% | 0.0% | 22.8% | 0.4% |
| 75 | Habeco | Beer | 32.2 | D | 100.0% | 3.3% | 0.0% | 0.0% |
| 76 | Savico | Automotive and Mobility | 32.1 | D | 100.0% | 0.0% | 5.2% | 0.0% |
| 77 | Viet Tien | Apparel and Textiles | 31.9 | D | 60.0% | 5.8% | 0.0% | 0.0% |
| 78 | KinhBac City (KBC) | Real Estate (Including Residential) | 31.6 | D | 100.0% | 0.0% | 0.0% | 0.0% |
| 79 | SHB | Banking | 31.3 | D | 96.7% | 0.8% | 0.0% | 0.0% |
| 80 | DEOCA Infrastructure | Transport Infrastructure | 31.1 | D | 100.0% | 0.0% | 0.0% | 0.0% |
| 81 | GELEX | Construction and Engineering | 31.0 | D | 100.0% | 0.0% | 0.0% | 0.0% |
| 82 | DGC (Duc Giang Chemicals) | Chemicals and Plastics | 30.5 | D | 100.0% | 0.8% | 11.5% | 0.0% |
| 83 | Vietnam Rubber Group (VRG) | Agribusiness | 30.5 | D | 100.0% | 0.8% | 0.0% | 0.0% |
| 84 | Petrovietnam | Energy (Including Oil & Gas) | 30.4 | D | 100.0% | 7.5% | 0.0% | 0.0% |
| 85 | Eximbank | Banking | 30.2 | D | 86.7% | 0.0% | 30.9% | 0.2% |
| 86 | Khang Dien | Real Estate (Including Residential) | 30.2 | D | 66.7% | 2.5% | 30.2% | 0.0% |
| 87 | Novaland | Real Estate (Including Residential) | 29.6 | D | 100.0% | 4.2% | 7.7% | 0.2% |
| 88 | Ha Do Jsc | Real Estate (Including Residential) | 29.6 | D | 96.7% | 0.0% | 6.0% | 0.0% |
| 89 | Vinacafe | Non-Alcoholic Beverages | 29.5 | D | 76.7% | 0.0% | 0.0% | 0.0% |
| 90 | Vinacomin (TKV) | Energy (Including Oil & Gas) | 29.3 | D | 100.0% | 2.5% | 1.1% | 0.0% |
| 91 | Hoang Huy | Real Estate (Including Residential) | 28.8 | D | 93.3% | 0.0% | 0.0% | 0.0% |
| 92 | Bach Hoa XANH | Grocery Retail | 28.7 | D | 56.7% | 20.8% | 0.0% | 0.0% |
| 93 | Dat Xanh Group | Real Estate (Including Residential) | 28.0 | D | 96.7% | 0.8% | 0.0% | 0.0% |
| 94 | Wake-up 247 | Non-Alcoholic Beverages | 27.4 | D | 100.0% | 0.0% | 2.4% | 0.0% |
| 95 | Quang Ngai Sugar (QNS) | Non-Alcoholic Beverages | 26.9 | D | 90.0% | 0.0% | 0.0% | 0.0% |
| 96 | Tuong An | Packaged Food | 26.4 | D | 76.7% | 0.0% | 0.0% | 0.0% |
| 97 | CII | Transport Infrastructure | 26.2 | D | 96.7% | 0.0% | 0.0% | 0.0% |
| 98 | Nam Ngu | Packaged Food | 25.0 | D | 76.7% | 0.0% | 1.2% | 0.0% |
| 99 | Pha Lai Thermal Power | Energy (Including Oil & Gas) | 23.2 | F | 86.7% | 0.0% | 0.0% | 0.0% |
| 100 | 333' Export (Sabeco) | Beer | 22.5 | F | 56.7% | 4.2% | 0.0% | 0.2% |
Two structural gaps worth naming. DOHACO and DEOCA Infrastructure have no website URL in the brand file, so their citation authority is unmeasurable rather than zero. A further set of brands' sites did not answer from the crawl network at all — consistent with geo-restriction of foreign traffic — and were recorded as unscored with the reason kept per brand, never scored low. A gap is not a zero.